 ZANSHIN
Sign in
Dealer positioning
What is a call wall and a put wall in options trading?
A call wall is the strike with the most call gamma, usually above price. A put wall is the strike with the most put gamma, usually below it. They mark where options hedging is heaviest, which is why traders watch the call wall as resistance and the put wall as support. Whether they actually hold depends on who is on each side of those options.
How a call wall and put wall are found
Every strike carries some gamma: the open interest there, times how sensitive each contract's delta is to price. Add it up per strike and two strikes stand out. The call wall is the one with the most call gamma, and the put wall is the one with the most put gamma. Most tools also show the next two (CW2, CW3, PW2, PW3). They move during the day as open interest and fresh trades change the book, and they reset as expiries roll off.
On its own a wall only says a lot of options sit here. It doesn't say who bought them and who sold them, and that decides what the hedging does.
When a wall holds: dealers long gamma
If dealers own the options at that strike (someone else sold them), they are long gamma there. To stay hedged they sell as price rises into the strike and buy as it falls back. That leans against the move, which is the case for a call wall acting as a ceiling and a put wall acting as a floor. Strikes where traders sell options for income, or the short leg of big collar trades, tend to work this way.
When a put wall is a trapdoor: dealers short gamma
Most put open interest is bought for protection, so the dealers on the other side are usually short those puts. Short puts are long delta, so dealers hedge by selling futures, and as price falls toward the strike the puts gain delta and they have to sell more. On the way in, that hedging pushes the drop further, not back.
So why do put walls still bounce so often? Three things happen at the strike itself:
- The selling peaks and runs out. Gamma is biggest at the strike; once price is through, there is less left to hedge, so the forced selling fades right around the wall.
- Put buyers cash in. Price reaching a big put strike is when those holders take profit, and dealers buy back the futures they sold as a hedge. That buying is the bounce.
- Time and volatility. As time passes or implied volatility drops, the puts lose delta and dealers slowly buy back hedges (charm and vanna).
That is the familiar pattern: a flush into the put wall, then a bounce.
| Who is on each side | As price moves into the wall, dealers… | Effect |
|---|---|---|
| Dealers long the options (traders sold them) | trade against the move | Support or resistance |
| Dealers short the options (traders bought them) | trade with the move | Acceleration into the strike, often a bounce once through |
Is a put wall support? What our data says
We tested the walls on every recorded session from 28 September to 9 October 2026 across SPX, SPY, ES, NDX, QQQ, NQ and IWM, counting a hold when price came 10 basis points back off the level before going 5 through it within an hour. The #1 put wall held 39% of the time against 37% for random prices; the #1 call wall 34% against 37%. On their own, walls were not better than random. They mark where hedging is heaviest, and something often happens there, a bounce or a run straight through; which one is what order flow at the level tells you.
One level did better than chance in the same tests: the most positive net-gamma strike within 1% of price held 46% of the time against 38% for random prices. That is the long-gamma case above.
How Zanshin Flow shows them
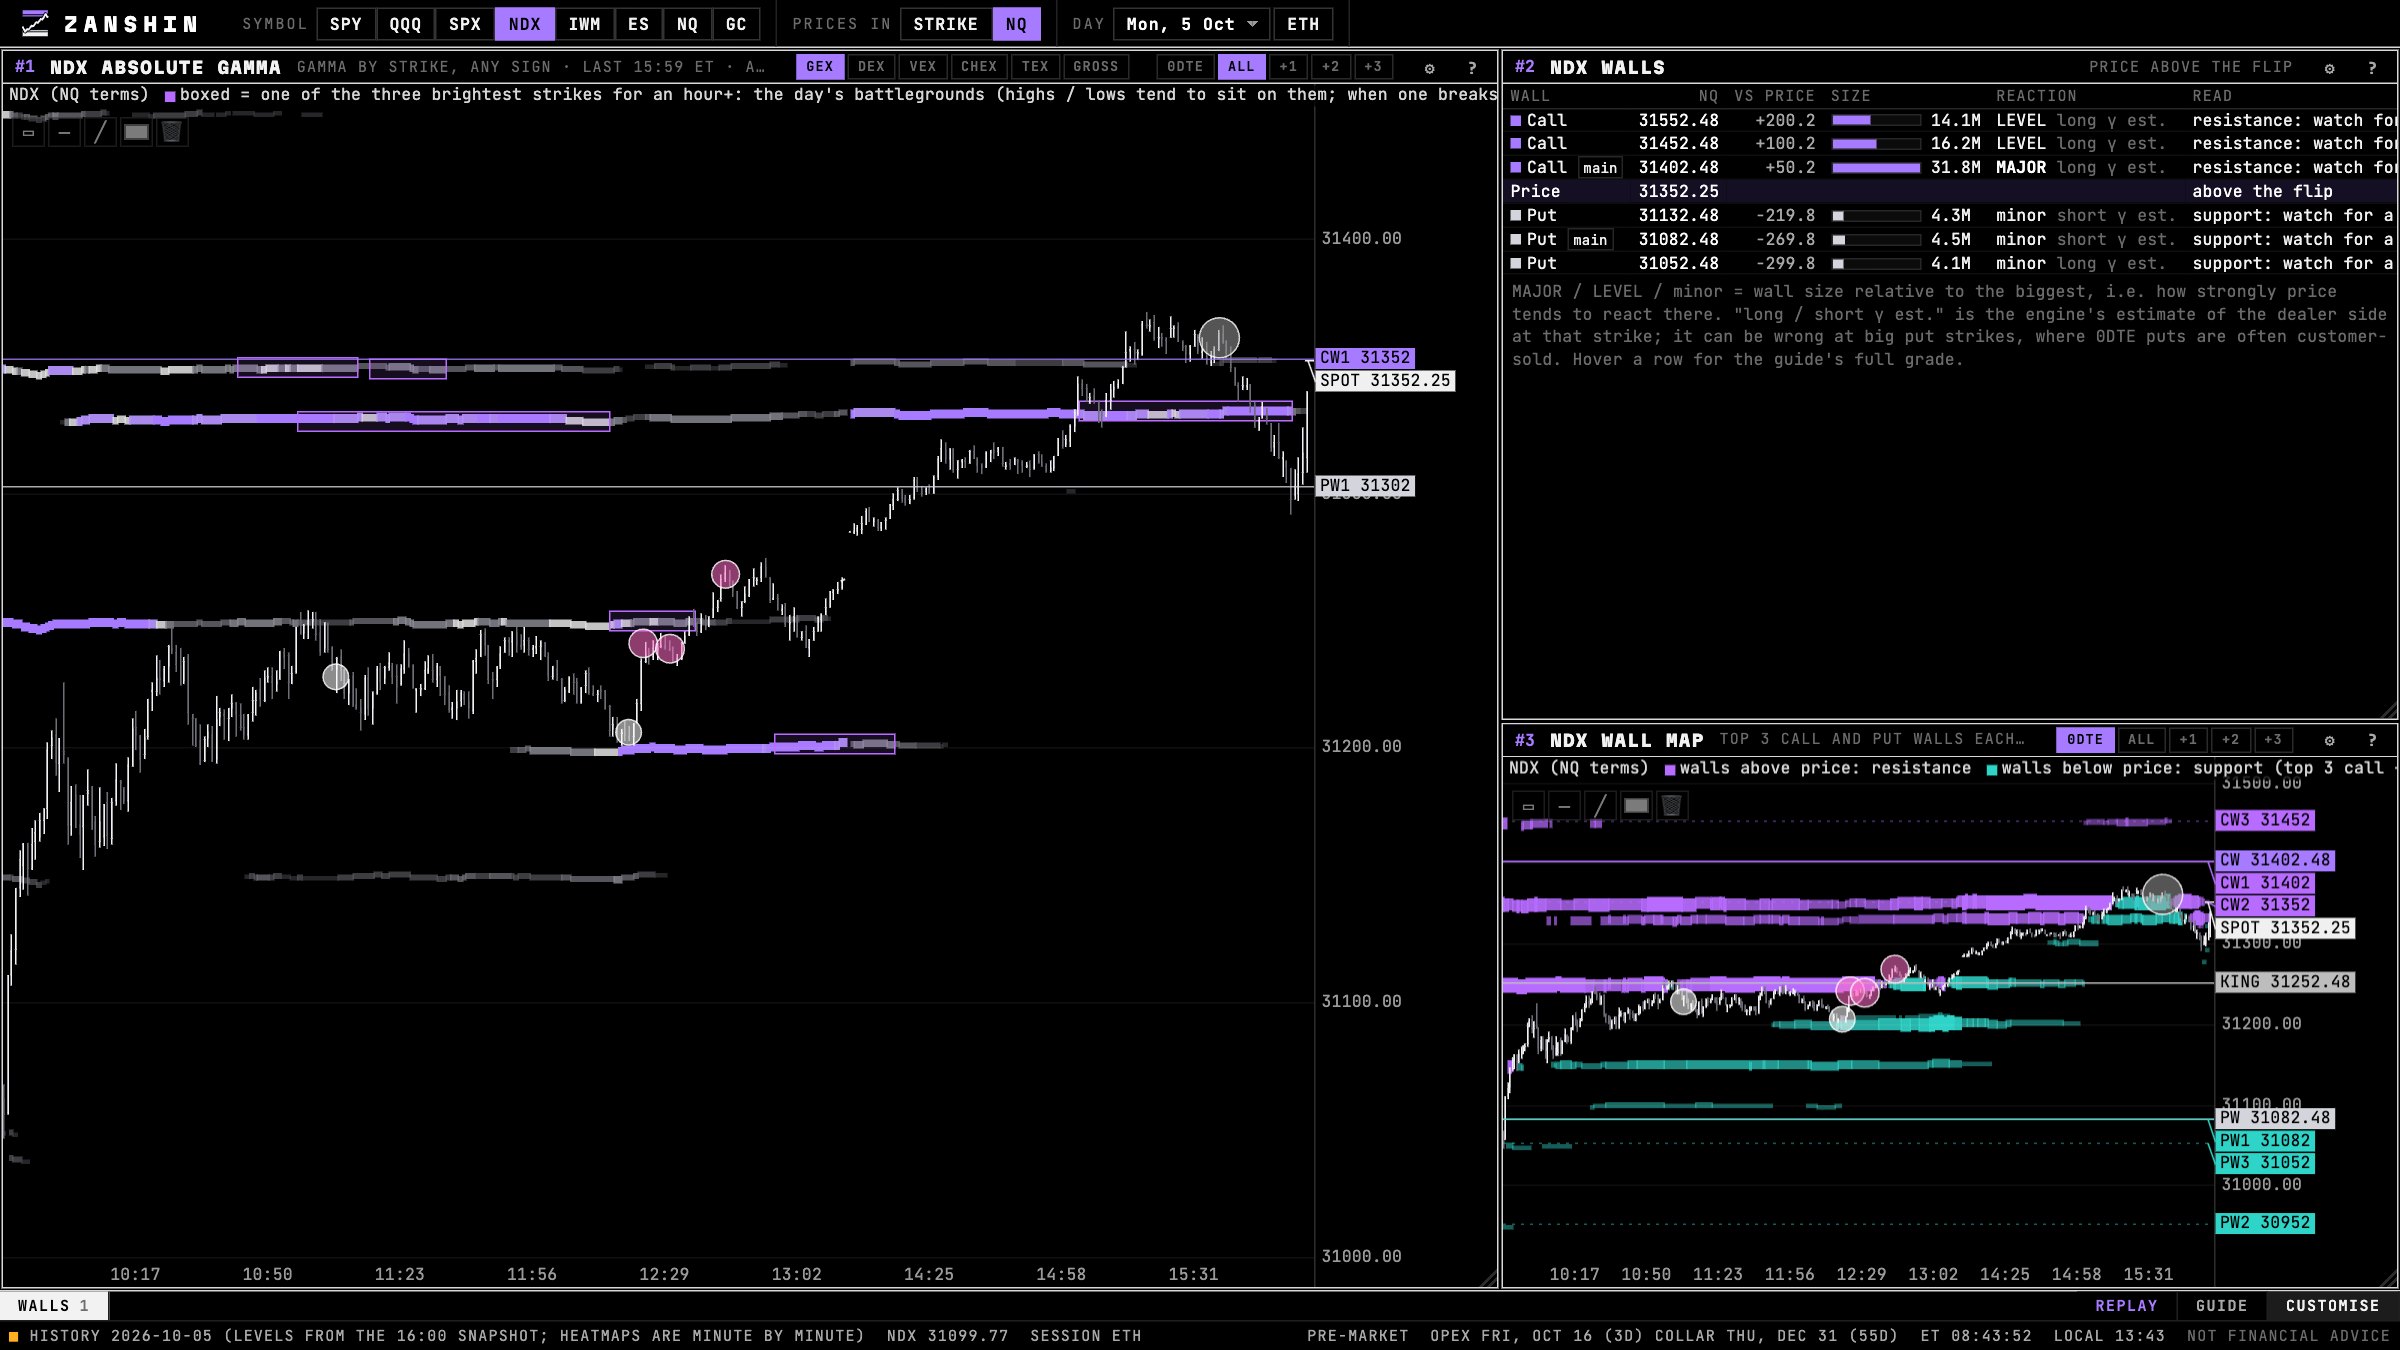
The walls are tagged on every chart's price scale (CW1 to CW3, PW1 to PW3) as they stood each minute, and mapped onto ES and NQ futures prices for index symbols. The Walls window grades each one and estimates the dealer side (long or short gamma), the thing that decides which case above you are in. Read more on gamma exposure, the gamma flip and dealer hedging.
Questions
What is a call wall?
What is a put wall?
What is a call wall in options trading?
Is a put wall support?
Is a call wall resistance?
What happens when price breaks a put wall?
How is a call wall calculated?
Not financial advice. This article explains how options and dealer hedging work. It is not a recommendation to buy or sell anything.