 ZANSHIN
Sign in
Volatility
Implied volatility skew: why puts cost more than calls
Skew is the difference in implied volatility between strikes at the same expiry. On equity indices, puts below the money trade at higher implied vol than calls the same distance above, which is the skew.
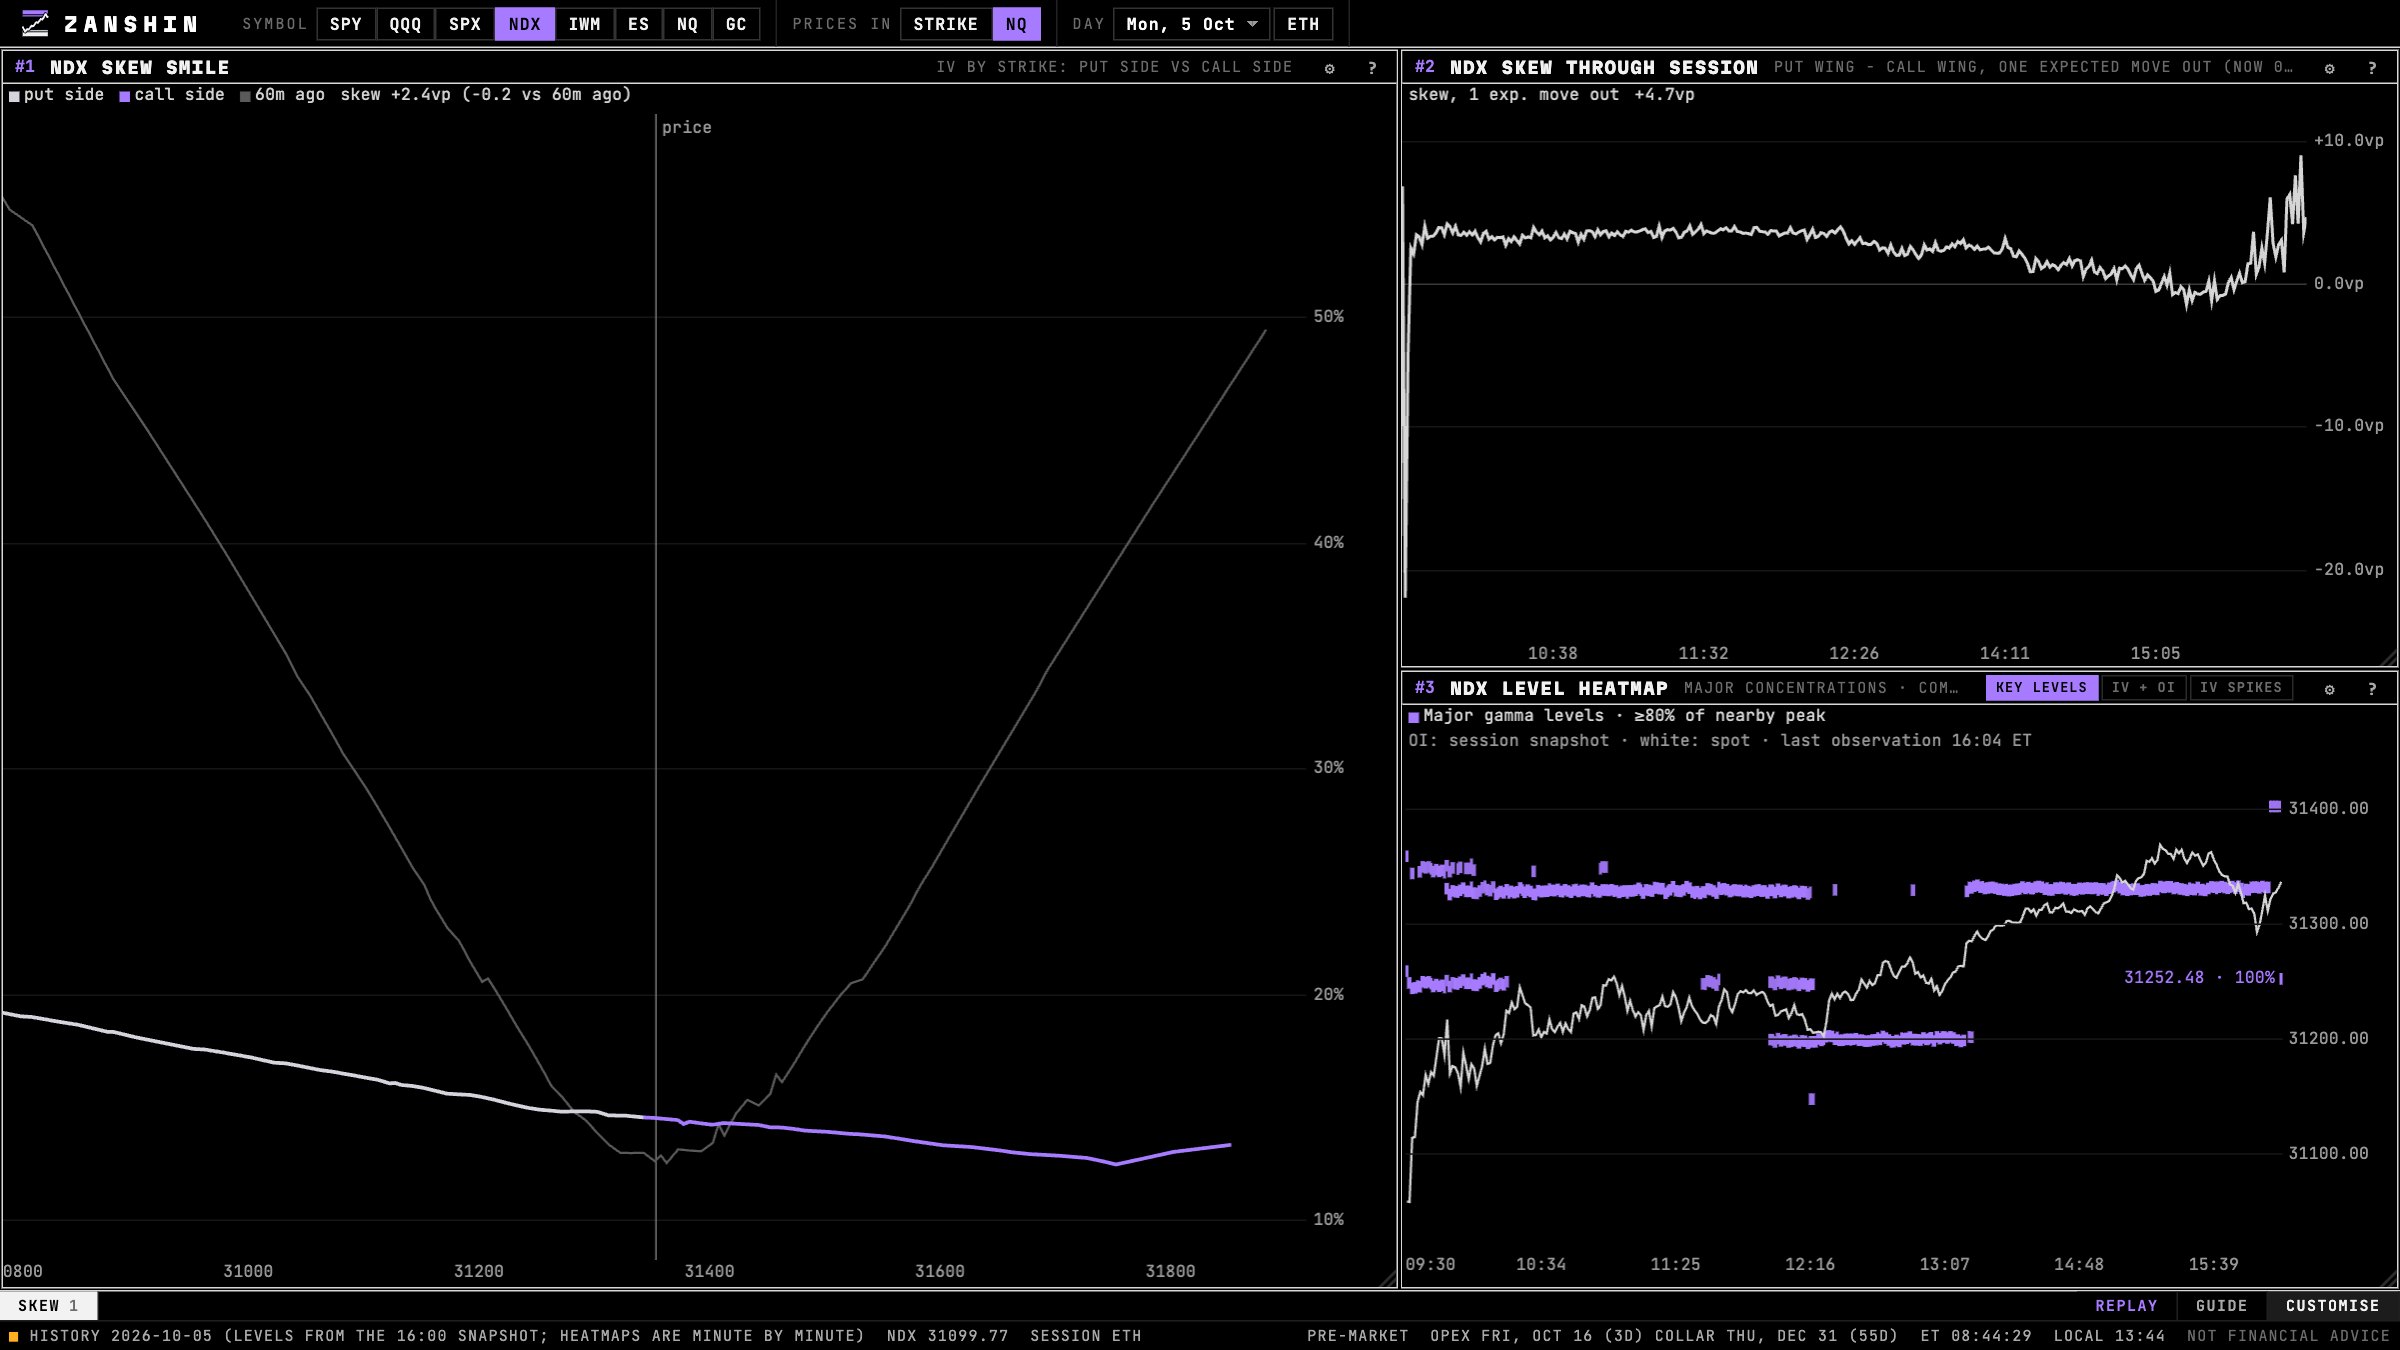
The smile and the skew
If Black-Scholes were literally true, every strike of an expiry would imply the same volatility. Plot implied vol against strike and you'd get a flat line. Real markets give a curve: the smile. On equity indices it's lopsided, high on the put side and lower on the call side, and that lopsidedness is the skew.
Why index puts are expensive
- Crash risk: indices fall faster than they rise, and investors pay for protection.
- Spot and vol move together: volatility tends to rise when the index falls, so downside strikes are worth more.
- Supply and demand: portfolio hedgers buy puts; overwriters sell calls.
Measuring it
A common measure is the 25-delta risk reversal: call IV minus put IV at the strikes with delta 0.25 and −0.25. Negative means puts are richer. Zanshin Flow measures put-side minus call-side IV one expected move from spot and tracks it through the session, beside an earlier smile for comparison.
Reading changes
Put skew rising while price is flat suggests protection is being bid; put skew falling while price rises suggests complacency. Read it as context about positioning, not as a timing signal.
Questions
What is volatility skew?
What is a risk reversal?
Why is there a volatility smile?
Not financial advice. This article explains how options and dealer hedging work. It is not a recommendation to buy or sell anything.