 ZANSHIN
Sign in
Markets · CL
Crude oil gamma exposure: dealer levels for CL futures
Zanshin Flow reads NYMEX WTI crude oil (CL) futures options as their own book, so you can see dealer gamma in oil by strike, live, around the clock, with the walls and flip in oil's own prices.
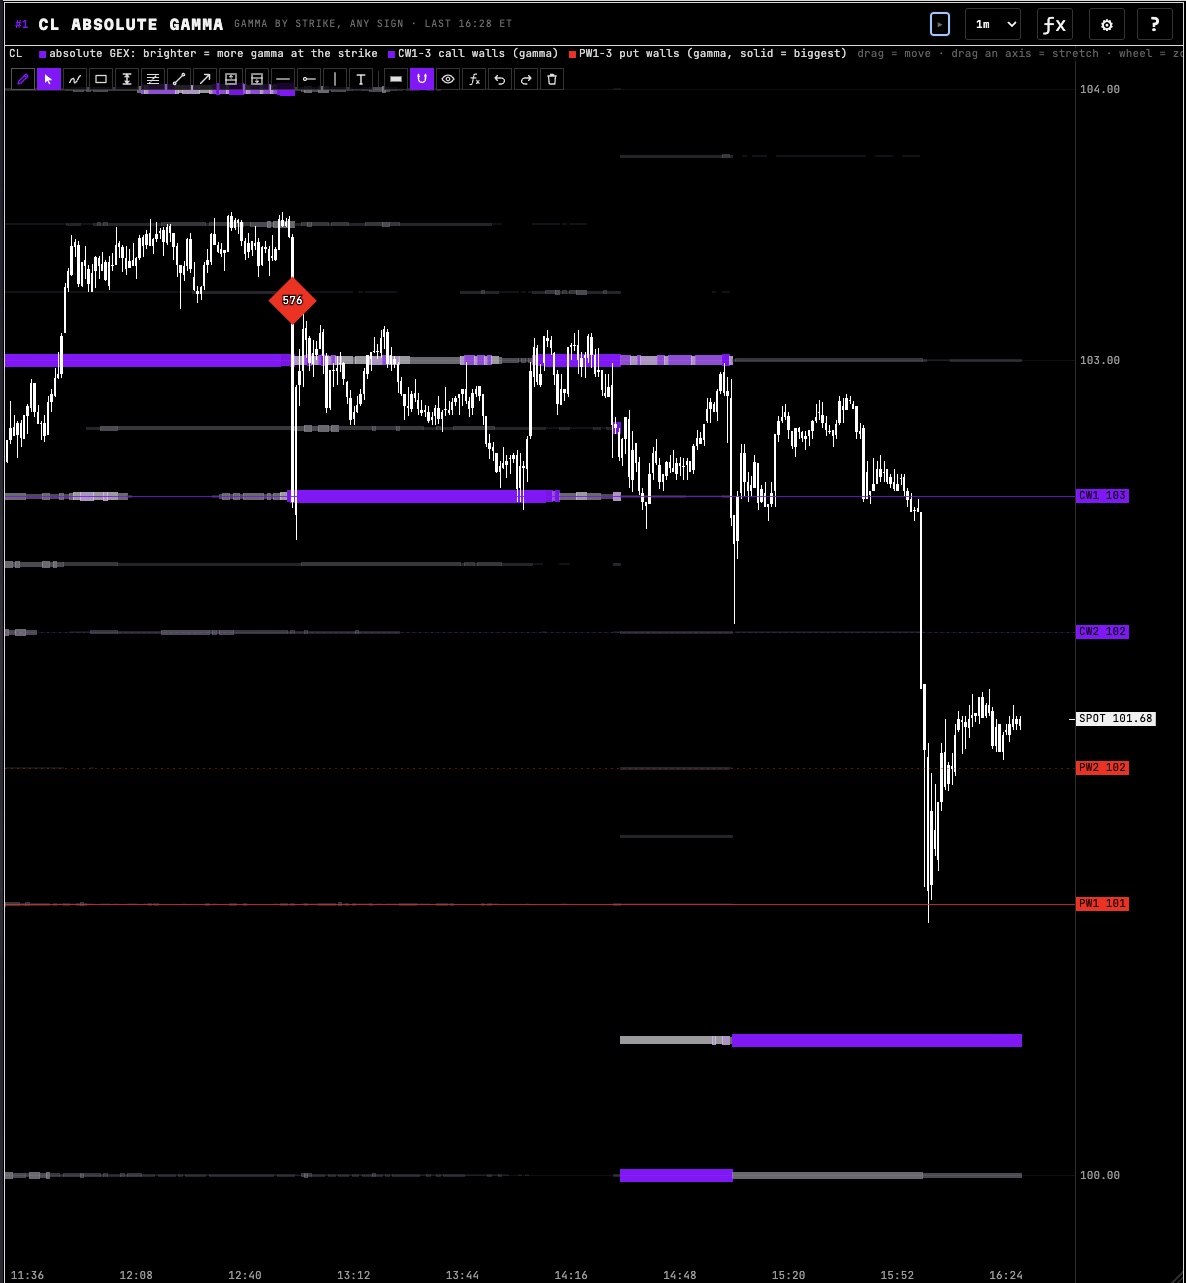
Oil's own options book
Crude oil options trade on CME's NYMEX, on the CL future. Zanshin Flow reads them directly, as a separate book from the indices: the strikes are oil prices in dollars per barrel, and each option is on one 1,000-barrel future, so the gamma and the hedging are stated in real dollars per $1 move in oil. Strikes within 5% of each option's own future are kept, where nearly all the gamma near the price sits.
The same front-month future also drives the crude quote in Zanshin Flow's macro windows, so the oil price on the gamma map and the one in the risk-on / risk-off read always agree.
Oil expires earlier than the indices
Crude's options settle at 14:30 New York time, not 16:00, in line with the oil pit close. Same-day oil gamma and charm peak before then, and Zanshin Flow times each expiry's decay, countdown and expected move to its own settlement, not the equity close.
What you see for crude oil
- Gamma by strike under price, with the call wall, put wall, gamma flip and expected-move bands.
- Any expiry: today's, each of the next three, all of them combined, or any mix.
- Charm and vanna by strike: oil's implied volatility moves a lot, so vanna, the hedge change from a change in implied vol, often matters as much as gamma.
- The oil options tape: big trades, premium by time and strike, and the dealer hedging flow they force.
- Level Check grading the level price is at.
A worked example, in barrels
Illustrative numbers, not a live quote. Say a strike has 6,000 contracts of open interest and each option's gamma is 0.08 per $1 of oil. If dealers are short those options, a $1 rise in oil raises the delta they're short by 0.08 × 6,000 = 480 futures, or 480,000 barrels. A $0.50 move is half that, about 240 futures. That's the hedge a gamma map estimates; whether it moves price depends on the liquidity trading at the time and on how far gamma itself changes over the move.
What it isn't
Oil reacts to inventory reports, OPEC and geopolitics, which can swamp any dealer hedge. Treat oil walls as context, not signals; nothing here is an edge on its own. The mechanics behind the map: gamma exposure explained and vanna.
Questions
Is there a gamma exposure tool for crude oil?
Are the oil levels from USO?
When do crude oil options expire?
Not financial advice. Zanshin Flow is an analytics tool; nothing on it is a recommendation to buy or sell anything.